How I'd Price a 12-Unit Cafe Group This Week, Step by Step

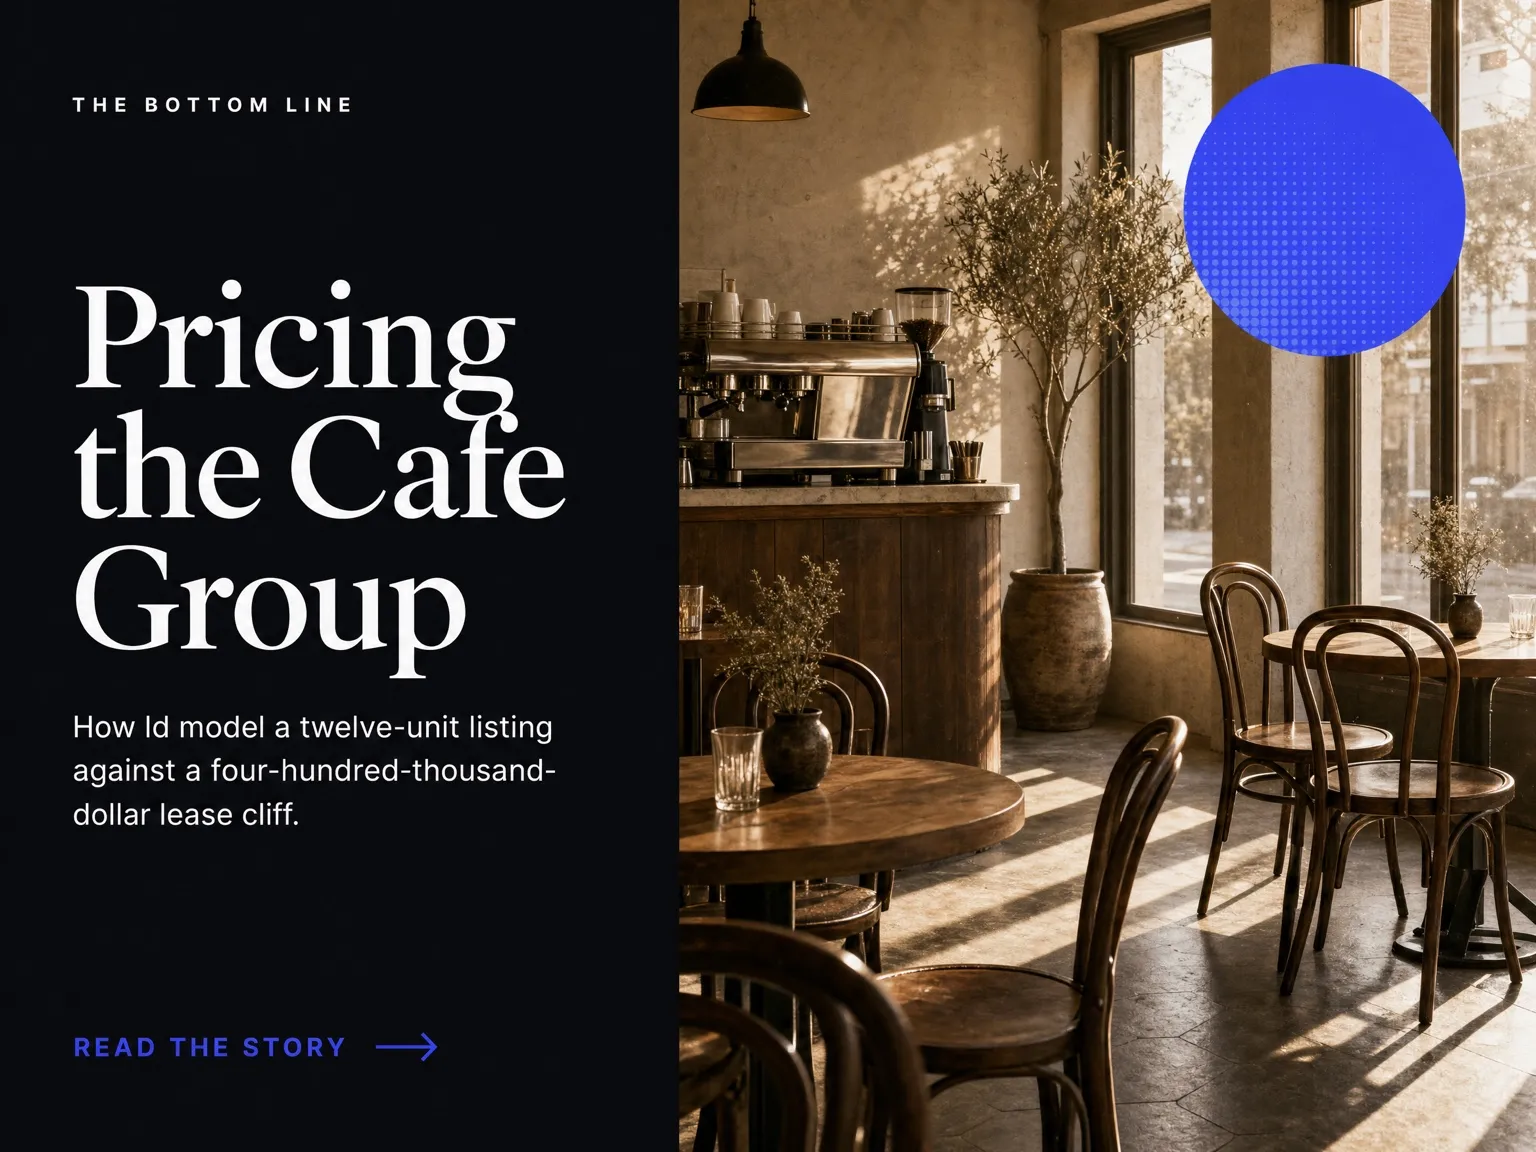
A buy-side walk-through. Real comps, real benchmarks, real debt costs. The 12-unit group is a composite — every multiple I use to price it is sourced.
It’s Sunday night. I’m at the kitchen table with a yellow pad and the composite I keep on my laptop for teaching purposes: a hypothetical 12-unit regional cafe group, $1.1M average unit volume, $13.2M trailing revenue, somewhere between $1.6M and $2.0M of trailing EBITDA depending on whether you believe the add-backs. Asking — call it — $9 million.
The question this piece is meant to answer is the one I get every week from LBO students and buy-side analysts: how do you actually price one of these? Not “what’s the multiple,” but the full walk — comps, benchmarks, debt, AI overlay, lease risk, the whole sequence.
A note on the worked example
The 12-unit group I use below is a composite. I built it from the metrics I see on hospitality marketplace listings every week — it’s not a single live deal, and the operator doesn’t exist. Every multiple, benchmark, comp, and pricing input I use to value it is real and cited. The point is the method, not the bid.
The fundamentals of the composite
Twelve units. AUV of $1.1 million. Trailing revenue $13.2M. The AUV number is deliberately chosen — it sits a little above the small full-service median but well below the AUVs you see on the public cafe comps. For context, Starbucks averaged $945,270 per unit in 2025 (Restaurant Business Online), Dutch Bros reported $2.2M AUV in Q1 2026 (Motley Fool transcript), Cava ran $2.9M AUV on the fiscal-year-2025 read (Cava IR), and Wingstop’s domestic AUV came down to $1.96M in Q1 2026 (Wingstop Q1 2026 transcript). Our composite cafe is roughly half the Starbucks AUV in dollar terms — which is what you’d expect for a regional non-drive-thru format.
Now the cost stack, using NRA’s 2025 Restaurant Operations Data Abstract benchmarks. Food and non-alcohol beverage costs ran a median of 31.0% of sales for full-service operators with sales above $2M and 32.4% for limited-service operators (NRA: food-cost ratios). Labor was 36.5% for full-service and 31.7% for limited-service at the median (NRA: elevated labor costs). Occupancy — rent plus CAM, taxes, building insurance — is industry rule-of-thumb 6–10% of sales, with anything over 9% considered high and 10% the point at which it “starts to seriously impair a restaurant’s ability to generate an adequate profit” (The Fork CPAs on percentage rent; Restaurant Resource Group rules of thumb).
Map those onto $13.2M of revenue: ~$4.1M food cost (31%), ~$4.4M labor (33%, blending toward limited-service since cafes lean counter-service), ~$1.1M occupancy (8.3%), and the remainder — other operating, G&A, marketing, repairs, insurance — at roughly 15–18%. Trailing EBITDA lands $1.6–$2.0M on a generous read of add-backs. We’ll model the midpoint, $1.8M.
That’s the asset. Now we price it three different ways.
Method one: public-market comps with a private discount
The cleanest pedagogical approach. Take TTM multiples for the cafe-adjacent publics, average them, apply a private-company discount, sense-check the answer.
The cafe-segment publics and where they trade right now:
- Starbucks (SBUX) — EV/EBITDA around 26–28× and EV/Sales around 2.8× on 2026 estimates (Alpha Spread relative valuation; Stocksguide forecast).
- Dutch Bros (BROS) — premium grower. Q1 2026 revenue $464M (+31% YoY), adjusted EBITDA $79M, AUV $2.2M (Motley Fool transcript).
- Cava (CAVA) — trading around 7.1× forward sales, restaurant-level margin guide of 23.7–24.2% for 2026 (TIKR analysis; Cava 2025 results).
- Sweetgreen (SG) — comp sales down 12.8% in Q1 2026, adjusted EBITDA loss of $8.1M, restaurant-level margin guided to 14.2–14.7% for the year (Motley Fool transcript).
- Chipotle (CMG) — EV/EBITDA around 21× as of February 2026, Q1 2026 sales $3.09B (Gurufocus EV/EBITDA; Chipotle Q1 2026 release).
- Wingstop (WING) — EV/EBITDA around 37–38×, Q1 2026 revenue $183.7M, adjusted EBITDA $65.4M (Stockanalysis.com; Wingstop transcript).
These are the wrong comps. Not slightly wrong — fundamentally wrong. They’re national franchise platforms with growth optionality, brand moat, and capital-markets access. Our composite is a 12-unit regional that nobody outside three zip codes has heard of. But they’re the comps the broker’s deck is going to show you, so understand them.
Median EV/EBITDA across the six is roughly 28×. Even at the lowest end (Chipotle’s 21×), applied to $1.8M of trailing EBITDA you get $37.8M. That’s the number a naive seller wants. The buyer comes back with a discount for lack of marketability that empirically runs 20–30% for healthy private companies, with restricted-stock studies putting the range as wide as 15–40% (Sofer Advisors DLOM primer; Wall Street Prep illiquidity discount; Damodaran on illiquidity discounts).
But DLOM alone doesn’t cover the gap. The bigger issue is the size and scope discount — these publics have 285 to 40,000 units; our composite has 12. The clean way to land this method: take public median EV/EBITDA of ~28×, haircut it 75% for size/scope/illiquidity, you get an effective ~7×. Apply to $1.8M EBITDA: $12.6M. That’s not the answer — it’s the ceiling. A buyer with a strategic angle might rationalise something near it; that is not what the deal will actually clear at.
Method two: transaction comps
This is the method that actually drives bid prices in middle-market hospitality M&A. Find recent deals at comparable scale, build a band, apply.
The recent cafe and fast-casual M&A I can actually source:
- Roark Capital / Subway, closed April 2024 for $9.6B all-in including earn-outs ($8.95B base + earn-out tied to cash-flow milestones), bids reportedly ranging $8.5B–$10B (Subway PR; QSR Magazine).
- RaceTrac / Potbelly, announced September 2025, $689M — that’s 1.5× EV/Revenue and 8.6× EV/EBITDA (Capstone Partners restaurant M&A update).
- Roark Capital / Dave’s Hot Chicken, June 2025, $1B for 75% — 1.6× on 2024 sales of $617M (Restaurant Business Online; Restaurant Dive).
- JAB Holdings / Pret a Manger, 2018 at £1.5B (~10× EBITDA at the time); Pret subsequently booked a £553M goodwill impairment in 2024 against an operating loss of £451.5M, with an IPO repeatedly delayed (JAB press release; Capital.com IPO analysis).
The Pret data point is the cleanest cautionary tale on cafe-format M&A in recent memory: pay 10× at the top, write down 35% of the goodwill six years later. JAB are some of the most sophisticated hospitality buyers on the planet and the cafe format still bit them hard. Cafes are exceptionally sensitive to labor inflation and lease economics, and both moved against Pret in ways the original underwriting didn’t price.
For a sub-$5M-EBITDA regional cafe group, the relevant band is not the Subway and Pret comps. It’s the long tail of small private deals that don’t make press releases. Auxo Capital Advisors’ 2026 restaurant M&A guide aggregates middle-market transactions and shows EBITDA multiples for single-concept regional restaurant groups clustering 3.5–6.0× depending on growth, brand, lease quality, and management depth (Auxo M&A guide; Auxo valuation multiples). Cafes trade at the lower half of that range — labor and lease sensitivity higher than full-service.
So: 3.5×–5.5× on $1.8M of EBITDA puts the transaction-comp range at $6.3M–$9.9M. That’s the band where this deal actually lives.
Method three: cash-on-cash with real debt
This is the method an operator-buyer using SBA financing will use, and it’s the most honest one for an asset at this scale. The buyer isn’t pricing growth optionality — they’re pricing the cash the asset will throw off against the debt they have to service to acquire it.
SBA 7(a) rates in early May 2026 run prime + a spread. Prime is 6.75% (GoSBA prime rate guide). For acquisitions over $350K the spread caps at +3.0%; most competitive lenders offer +2.25–2.75% for strong borrowers, putting real rates at 9.00–9.50% — though restaurants are higher-risk and tend toward the cap (NerdWallet SBA loan rates; GoSBA 7(a) guide).
Call it 9.5% on a 10-year SBA 7(a). The buyer puts $7M on the asset with 25% equity ($1.75M equity, $5.25M debt). Annual debt service is roughly $815K. Against $1.8M EBITDA minus $400K of maintenance capex (3% of revenue — light but defensible), you get $1.4M of free cash flow before debt service, $585K of cash to equity on $1.75M down. That’s 33% cash-on-cash year one.
That’s an excellent number, and the number the seller will use to argue the asset is worth more than $7M. They aren’t wrong about the math. They’re missing two things. First, 33% assumes trailing EBITDA is durable — it often isn’t, for reasons in the lease section below. Second, the 9.5% SBA loan amortising over 10 years means the buyer’s personal guarantee is on $5.25M, and if any underwriting assumption misses by 15%, the cash-on-cash inverts fast.
Run honestly, $6.5M–$8.5M is the price where an operator-buyer with SBA debt can sleep at night. Higher and you’re betting on growth you haven’t underwritten.
The AI overlay
Here’s where I disagree gently with Marcus Bell about underwriting the AI premium brokers now attach to listings. Marcus argued in his weekly roundup that the move is to “diligence the claim, not the headline” — correct, as far as it goes. There’s a step before that: price what the AI stack actually costs the buyer, then ask whether the seller’s claimed uplift is real.
Real subscription costs for the tooling stack a 12-unit cafe group is likely running, with public pricing pages:
- Toast POS at the realistic operating spend for a multi-unit cafe: ~$300–$1,000 per location per month all-in with processing add-ons (Toast pricing; Merchant Maverick breakdown). At 12 units, call it $7K–$10K per month, $84K–$120K per year.
- Lightspeed Restaurant at Essential ($189/mo) or Premium ($399/mo) per location, plus $30/screen for KDS (Lightspeed pricing).
- SevenRooms starting at $499/month per venue with custom enterprise pricing for multi-unit operators (SevenRooms on G2).
If a 12-unit cafe group is running Toast + a reservations/CRM layer + a marketing automation tool, the annual software bill is roughly $150K–$250K. That’s 1.1–1.9% of revenue. It is not zero, but it is also not the thing that swings the valuation.
The real AI capex question is what Sweetgreen reported for Infinite Kitchen, which is the cleanest disclosed AI-capex benchmark anywhere in fast-casual: roughly $450K–$550K per unit of incremental capex for the automated makeline (beyondSPX analysis; Sweetgreen Q1 2026 transcript). And note the context: Sweetgreen’s comp sales fell 12.8% in Q1 2026 even with the Infinite Kitchen rollout. The capex went in; the comp didn’t show up. That should make every cafe-group buyer humble about the AI-uplift thesis. I wrote about exactly this last week — the AI premium in restaurant valuations is a thesis that has to be earned by data-room numbers, not by deck claims.
For a 12-unit cafe group, the right way to underwrite the AI overlay is: zero credit for “AI-enabled ops” unless the data room shows you the labor-hours-per-cover trendline moving in the right direction over 18 months. You can read about Chipotle’s full AI stack and what it actually moved in post 12, and Sweetgreen’s Infinite Kitchen capex treatment in post 11. Both deserve your time before you bid a premium on any cafe asset with “AI” in the deck.
The lease cliff
This is the section that decides the bid. Cafes carry occupancy at 6–10% of sales, and renewal economics are where most deal spreadsheets quietly lie to their owner.
Suppose four of our 12 leases come due within 24 months. Cafe-suitable retail in growth metros has moved through the post-pandemic period; comparable cafe rents are up roughly 12–18% over typical 5–7-year original terms. When a landlord has a long-tenured tenant generating six-figure annual rent and proven location economics, the renewal letter comes in at or above market — the tenant’s leverage is bounded by the cost of replacing a built-out box.
Four leases renewing at +15% on a base rent of ~$140K per unit per year: $84K of incremental annual rent across the four units. That’s 0.6% of revenue but ~4.7% of trailing EBITDA. At +20% — the upper end in metros where new cafe supply is constrained — the EBITDA haircut is closer to 7%.
Apply this and durable EBITDA drops from $1.8M to roughly $1.65–$1.7M. Re-run methods one through three on the durable number and the answer shifts down 8–10% across the board. Don’t argue with the seller about the headline multiple. Argue the structure — earn-outs tied to renewal outcomes, seller financing held against renewal terms, reps on landlord communications.
What I’d actually bid on the composite
Putting the three methods together against $1.65–$1.7M of durable EBITDA:
- Public-comp ceiling (post 75% size/scope haircut, generous): ~$12M
- Transaction-comp band (3.5–5.5× durable): $5.8M–$9.4M
- Cash-on-cash (operator-buyer with SBA): $6.5M–$8.5M
The cluster is $6.5M–$8.5M. Within that, my actual structured bid on the composite at $9M ask:
- $6.5M upfront in cash at close, financed roughly 70% SBA 7(a) at 9.5%, 30% buyer equity.
- $1.0M earn-out tied to durable EBITDA holding at or above $1.6M for two years post-close. This is lease-cliff insurance — if renewals come in soft, the seller eats the haircut; if they come in well, the seller gets to the headline price.
- $0.5M seller financing at 6% over three years, balloon. Keeps the seller engaged on transitions and gives the buyer a small structural backstop.
Total potential consideration $8.0M, of which $6.5M is hard cash at close and $1.5M is contingent. That’s a 4.4× headline on the trailing $1.8M EBITDA and a 4.7–4.8× on durable EBITDA — squarely in the transaction-comp band, generous on the cash component, structured on the contingencies.
The seller says no the first time, ten times out of ten. Six times out of ten they come back at $7.5M cash + $1M earn-out, and that’s a deal worth closing. The other four times the asset goes to someone who pays $9M cash on the headline and learns, eighteen months in, that the lease cliff was real. I would rather lose the deal than be the buyer in the second one.
What I’d watch from here
Three things would change my bid materially. First, lease abstracts in the data room — actual renewal terms, landlord names, in-place CAM escalators. Second, catering and off-premise mix. The composite assumes a 20% catering attach rate; the distributor consolidation analysis I wrote earlier is worth re-reading if you want to understand why catering input costs are quietly the thing that decides whether mid-market cafe groups can hold gross margin through 2026 and 2027. Third, the AI/dashboard claim. Reality two until proven otherwise, as I covered in the AI-premium piece last week.
The deepest single piece on margin sensitivity for cafe formats is Eitan’s four-margins framework from earlier this month, and I link to it in every deal memo I write on this category. The four margins are the right lens. The single-margin trailing-EBITDA lens, which is what most brokers’ decks lead with, is the wrong lens.
Price the asset. Price the structure. Price the cliff. Then bid.
— Oliver writes the buy-side perspective for The Bottom Line. He teaches hospitality LBO modeling at a leading business school. Tips: tips@tabletransfers.com.
Featured
More
Browse all 494 posts
The Voice Agent Maturity Curve
mise
·12 min read
The Four Margins of a Restaurant
mise
·14 min read
The AI Premium in Hospitality M&A: Broker Story or Real Number?
the bottom line
·9 min read
What the DoorDash/SevenRooms Deal Actually Buys
the bottom line
·11 min read
Related posts
the bottom line
·11 min read
Darden trades like a tech company. It shouldn't.
the bottom line
·12 min read
Applebee's just became its own franchisee. The territory math is the trade.
the bottom line
·12 min read