The Four Margins of a Restaurant

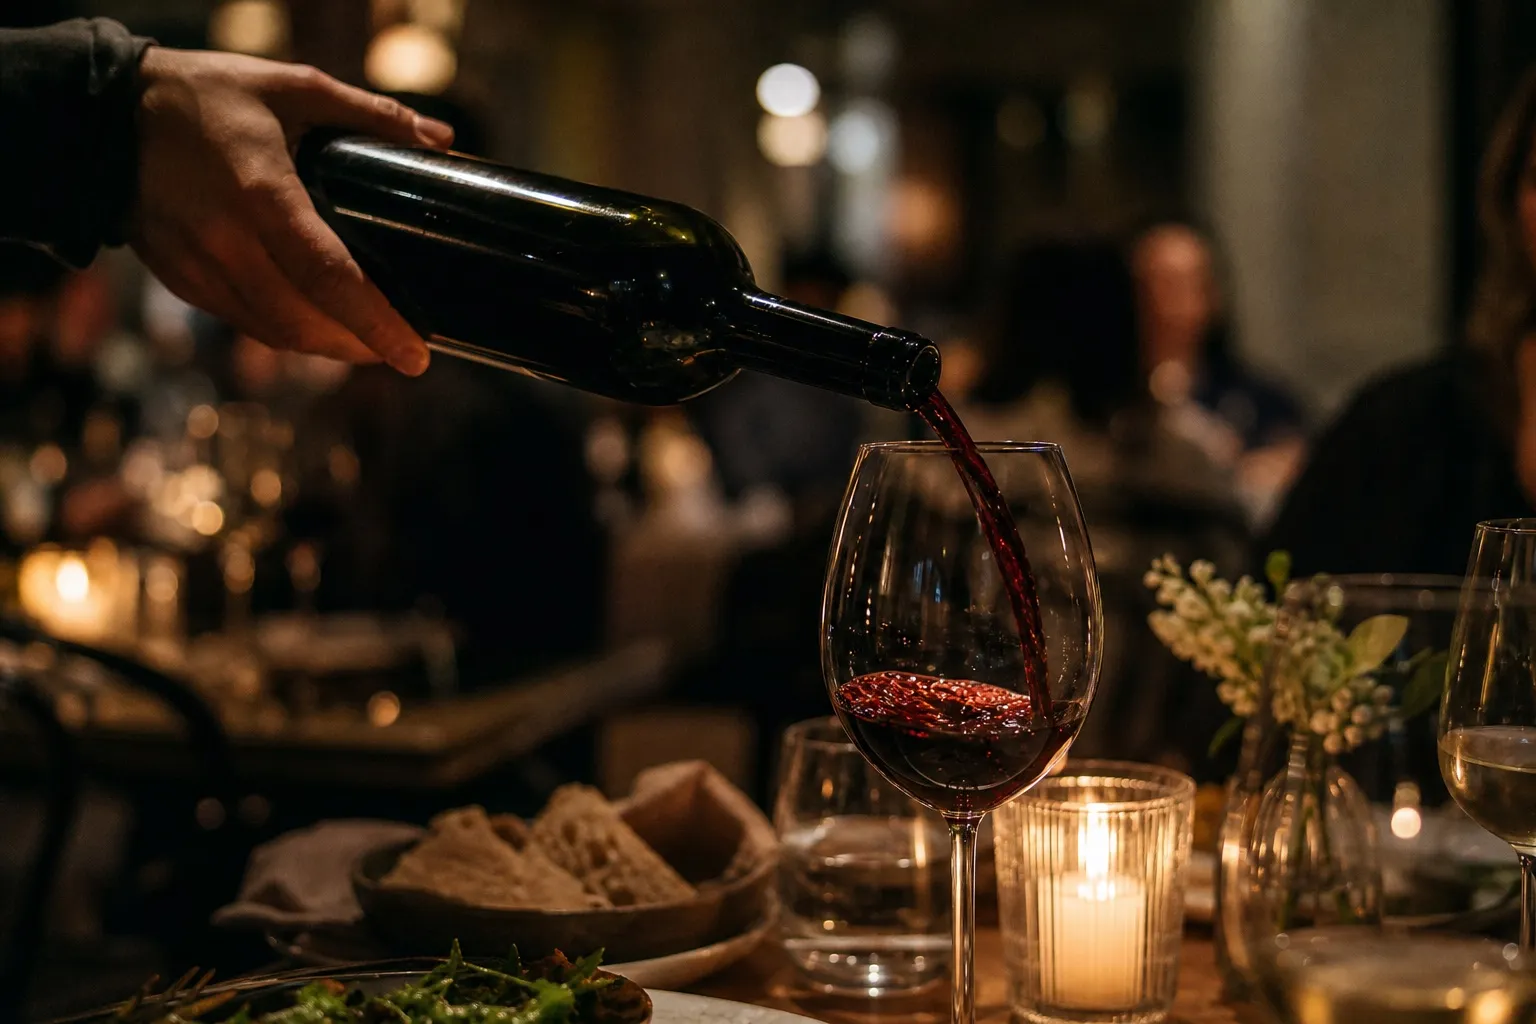
Gross is your chef's number. Operating is your business's number. Brand is the premium your concept commands. Enterprise is the number that decides whether you should own the restaurant at all. Most operators run the wrong one. The frame that anchors every piece of TableTransfers coverage.
It is eleven-fifteen on a Friday night and the daily report is on the bar in front of me. The second seating has cleared and I have ten minutes before the GM comes to find me with something I will need to decide. The report shows what every restaurant report shows: covers, average check, food cost, beverage cost, labour cost, comps, voids. Two columns: today and trailing-thirty. I can read it in forty seconds. Most operators I know can read theirs in forty seconds too.
The problem is that the number I want — the one that would actually tell me whether the last six months of work have made the restaurant more valuable, or whether they have quietly made it less valuable — is not on the report. It has never been on the report. In fifteen years of owning restaurants across three concepts and a commissary, I do not think I ever saw a daily report that surfaced it. So I want to spend this Mise essay arguing that there are four margins in a restaurant, that most operators run the wrong one, and that the daily report — the document we have built our weeks around — is structurally hostile to three of the four. This is the frame that anchors everything else TableTransfers publishes.
The thesis
Most operators obsess over gross margin while their operating margin erodes, their brand margin never gets named, and their enterprise margin quietly collapses. The four numbers are not interchangeable, the lever for each is different, and the daily report — by design — only reports the first one cleanly. The job of an owner, as distinct from a chef, is to know which of the four is breaking this quarter and to spend the week working on that one. The job of TableTransfers, as a publication, is to give you the vocabulary to name which one.
Margin one: gross — the chef’s number
Gross margin is cost of goods sold divided by revenue. In restaurant English: food cost percent, plus beverage cost percent, subtracted from one. The National Restaurant Association’s 2025 Restaurant Operations Data Abstract — the gold-standard cost-of-goods benchmark for U.S. operators — puts food and non-alcohol beverage cost at a median of 31.0% of sales for full-service operators with sales above $2M, and 32.4% for limited-service (NRA: food-cost ratios). For wage-and-employment context I cross-check against the BLS Industries at a Glance for Food Services, which is the specific page where the wage and employment series live.
I tell you these numbers so you can see how narrow the band is. The difference between a well-run kitchen and a sloppy one, in gross-margin terms, is three or four points of cost. That is real money on a $4M sales line. It is the number every chef I have ever worked with knows by heart. It is the number quoted in every chef interview about the cost of running a restaurant. It is the number the daily report puts at the top.
It is also — and this is my opinion, not a benchmark — the most over-watched number in the industry. Not because it doesn’t matter. It matters. But because the chef-owner culture this industry was built on trained two generations of operators to believe that gross margin is the only margin, and that working on gross margin is the work. It is not the work. It is one quarter of the work. The other three quarters do not show up on the daily report and so most operators never learn to see them.
Margin two: operating — the business’s number
Operating margin is what is left after you take gross margin and subtract everything else that runs the restaurant: labour, rent, utilities, marketing, software, insurance, repairs, the GM’s salary, the cleaning company. On the NRA’s 2025 read, median labour cost ran 36.5% of sales for full-service and 31.7% for limited-service (NRA: elevated labor costs). Occupancy — rent plus CAM, property tax and building insurance — is industry rule-of-thumb 6–10% of sales, with anything above 9% considered high and 10% the point at which it “starts to seriously impair a restaurant’s ability to generate an adequate profit” (The Fork CPAs on percentage rent; Restaurant Resource Group rules of thumb). Stack those, plus utilities and controllables, and the bottom of the operating-margin range for most independent full-service restaurants is somewhere between 5% and 15% of sales before debt and depreciation.
The lever for operating margin is not the protein invoice. It is labour productivity, occupancy cost, and the cost of running the back office. This is where almost all the recent AI tooling sits. A few specific data points I trust, each traceable to a single article:
- Sweetgreen’s Infinite Kitchen has held a labor-cost advantage of “more than 700 basis points” at IK-equipped stores versus classic locations of similar age, restated by CEO Jonathan Neman on both the Q4 2025 earnings call and the Q1 2026 call. 700 basis points is a generational shift in operating margin if it holds at scale; the fact that the number has been restated quarter-after-quarter is itself a tell that it is holding. I covered the full deployment in our Infinite Kitchen case study.
- Toast’s AI-powered menu upsell has been credited by one pilot restaurant with a 6% lift in average order volume, disclosed on Toast’s Q1 2025 earnings call and reported by PYMNTS in May 2025. AOV lift is technically a revenue lever, but because the incremental cost of an upsell is near-zero, almost all of it flows to operating margin.
- Sysco’s AI360 programme reached roughly 90% adoption among its sales consultants within roughly 45 days of launch, disclosed by CEO Kevin Hourican on the Sysco Q1 fiscal 2026 earnings call. I walked through what that means at the back door in our Sysco software-pivot piece.
- The cost side of the stack matters too. Toast’s published software pricing for its flagship package runs roughly $69–$165 per terminal per month plus payment fees (Toast pricing). A multi-unit operator who has not audited their software stack in two years is almost certainly carrying duplication.
Opinion, not benchmark: operating margin is where the AI conversation actually lives. The startups that genuinely move it can tell you, in a sentence, which line item on the operating P&L they reduce. The ones that cannot, do not.
If gross margin is the chef’s number, operating margin is the GM’s number and the CFO’s number. It is the number that decides whether the unit is a real business.
Margin three: brand — the most underweighted number
Brand margin is the premium a known concept commands above the commodity version of the same dish in the same neighbourhood. It is the gap between the price your menu can hold and the price an unknown competitor down the street can hold. It does not appear on any daily report I have ever seen.
The cleanest way to see brand margin is to look at the public comp set, where the spread is on the record. Cava’s most recent fiscal-year disclosures show restaurant-level margin guidance of 23.7–24.2% for 2026 and AUV around $2.9M — both materially above the fast-casual median (Cava Group fiscal 2025 results). Chipotle’s Q1 2026 release shows $3.09B of quarterly sales on a fleet of roughly 4,000 units, with brand-led pricing power holding price increases through a tough comp environment. Wingstop’s Q1 2026 transcript shows revenue of $183.7M and adjusted EBITDA of $65.4M on a roughly $1.96M domestic AUV — a margin profile that exists because the brand commands a price the average wing joint cannot. Dutch Bros’ Q1 2026 transcript shows 31% revenue growth and a $2.2M AUV — that is brand-led pricing power in a category whose commodity version is a regional drive-through.
Brand margin in independent restaurants is harder to see because there is no public filing to point at, but every operator who has ever taken a $34 entree past the credibility line knows it exists. The lever is concept clarity, repeat-guest density, press, and the discipline to price up when the concept earns it. The reason most operators underweight it is that the daily report rewards food cost and labour cost. It does not reward “we held a $4 price increase in Q2 without comp degradation,” which is the actual evidence that brand margin is alive.
Opinion: this is the margin most independent operators leave the most money on the floor on. I have done it myself. I held prices flat in 2022 because I was afraid of the comp signal, and the next year I had to take the price increase against worse cost inflation and a softer guest. Brand margin compounds, and the cost of under-pricing it is paid in the operating margin a year later.
The Toast AOV data point above (PYMNTS) is, properly read, a brand-margin data point as much as it is an operating-margin one. The reason the upsell works is that the brand has earned the right to recommend something incremental. A weak brand cannot upsell.
Margin four: enterprise — the number that decides whether you should own the restaurant
Enterprise margin is the multiple a buyer will pay for the business, multiplied by the operating margin you have built, minus the cost of the capital and the founder time it took to build it. In one sentence: enterprise margin is what the business is worth to a buyer, net of what it cost you to own.
You can see enterprise margin most clearly in the public comps and the recent transaction comps.
Public-company EV/EBITDA multiples for restaurant operators run across a wide range, and the spread tells you exactly which brands have brand margin and which do not. The relevant article-level reads, as of Q1 2026:
- Chipotle has traded around 21× EV/EBITDA on a trailing read as of February 2026 (Gurufocus EV/EBITDA history for CMG), against quarterly sales of $3.09B (Q1 2026 release).
- Wingstop has traded around 37–38× EV/EBITDA (Stock Analysis WING statistics) against Q1 2026 adjusted EBITDA of $65.4M (Q1 2026 transcript).
- Cava has traded around 7.1× forward sales with a 23.7–24.2% restaurant-level margin guide for 2026 (Cava fiscal 2025 results).
- Dutch Bros is the premium grower in the comp set with 31% YoY revenue growth and a $2.2M AUV (Q1 2026 transcript).
- Sweetgreen has traded at a discount as comp pressure has compressed margins — comp sales fell 12.8% in Q1 2026 with an $8.1M adjusted EBITDA loss (Q1 2026 transcript).
- Toast Inc. has reframed the AI surface as deepening the moat rather than producing a discrete revenue line — guidance for 2026 is 20–22% recurring gross profit growth and $775M–$795M of adjusted EBITDA, per CEO Aman Narang on the Q4 2025 earnings call.
The point is not the specific number on a given Tuesday. The point is the spread. The market pays a different multiple for the same dollar of EBITDA depending on which brand produced it.
Recent M&A transactions make the same point in cash terms.
- DoorDash / SevenRooms, announced May 6 2025, $1.2B in cash (CNBC, May 6 2025). DoorDash paid a strategic premium for SevenRooms because the guest data and the front-of-house surface fit into DoorDash’s commerce platform — I walked through the strategic logic in our DoorDash piece. That premium is enterprise margin: the buyer assigning a higher value to the asset than the asset’s standalone operating cashflow would justify, because of where it fits.
- Sysco / Restaurant Depot, announced March 30 2026, $29.1B (Sysco IR, March 30 2026). This is enterprise margin at the distributor scale — see our coverage of Sysco’s software pivot for the longer arc.
- Amex / Tock, the $400M Amex purchase in 2024 (TechCrunch on the $400M figure). American Express paid for a reservations platform whose value to Amex’s card-network strategy is greater than its standalone operating profit.
- Sweetgreen / Wonder (Spyce), November 2025, $186.4M ($100M cash + $86.4M in Wonder Series C preferred), with Sweetgreen retaining a cost-plus-5% supply-and-license agreement (Restaurant Business, November 2025). A clean example of an operator monetising the technology layer while keeping the operating capability.
In every one of these deals, the buyer paid more than a strict operating-margin model would justify. That gap is enterprise margin. It is what the seller’s brand, data, geography, or strategic fit was worth to that buyer. Marcus Chen’s recent valuation walk-through (Bottom Line, post 18) shows the same dynamic at the independent-group scale.
Opinion: enterprise margin is the margin almost no operator actively manages. They manage it implicitly — by building a strong concept, by holding their lease, by not over-leveraging — but they do not have a number for it. They have a vague sense of “what the place might sell for.” The vague sense is the problem. Enterprise margin should be calculated once a year, written down, and revisited every twelve months against changes in the comp set and changes in the business. If you cannot tell me what your enterprise margin is today, you do not know whether the last year of work has made you richer or poorer as an owner.
How to use the frame
Four concrete actions, in increasing order of how uncomfortable they will be:
-
Tag every margin-affecting decision by which margin it moves. When a vendor pitches you, ask which of the four. When your chef proposes a menu change, ask which of the four. When your GM proposes a labour change, ask which of the four. The vocabulary is the lever. Within a quarter your meetings will be sharper.
-
Read the operating-margin report on Monday, not the food-cost report. The food-cost report can be read once a week, in five minutes. Operating margin is where your week’s attention belongs. This is the single highest-leverage shift in an operator’s week, and it costs nothing.
-
Calculate brand margin monthly. Run a like-for-like comparison: your average check on a defined dish set, against the nearest commodity competitor on the same dish set. If the gap is widening, your brand is compounding and you have pricing room. If it is narrowing, your brand margin is eroding and operating margin will follow within four quarters.
-
Calculate enterprise margin annually. Pick a defensible multiple from the article-level comps above (Chipotle, Wingstop, Cava), haircut for size and illiquidity the way Oliver does in Bottom Line, post 18, apply to your trailing-twelve operating profit, subtract the cumulative founder-time and cost-of-capital you have invested in the year, and write the number down. The first year you do this it will be uncomfortable. The second year it will be the most useful number in your business.
Oliver Bennett’s valuation walk-through and the Bottom Line piece on the DoorDash/SevenRooms read are the closest companion pieces on enterprise margin. The forthcoming Mise on the voice-agent maturity curve is the operating-margin companion to this one.
The TableTransfers worldview
This is the frame every piece on the site is anchored in. When the Vibe Check team reviews a tool, they will name which of the four margins it primarily moves. When Bottom Line walks a valuation, they will disaggregate to the four. When Pass runs a news brief, the closing read will name which margin the announcement targets. When Operator publishes a playbook, the playbook will be tagged by margin. If we publish a piece that uses the word “margin” without naming which one, we have failed our own frame, and you should write me to call it out. The vocabulary is the work.
— Eitan writes Mise. He founded TableTransfers after selling his last restaurant group. Tips: tips@tabletransfers.com.
Featured
More
Browse all 494 posts
The Voice Agent Maturity Curve
mise
·12 min read
The Four Margins of a Restaurant
mise
·14 min read
The AI Premium in Hospitality M&A: Broker Story or Real Number?
the bottom line
·9 min read
What the DoorDash/SevenRooms Deal Actually Buys
the bottom line
·11 min read
Related posts

mise
·20 min read
The Voice Agent Maturity Curve

mise
·26 min read
The Four Tables: Why the reservation system is the most contested square foot in hospitality

mise
·22 min read